Here’s a fun way to cap off your week.
The Congressional Budget Office has just released three very telling infographics which, unintentionally, spell out a pretty dreary picture of US government finances.
The first graphic shows US federal revenue, both in raw numbers ($2.3 trillion in 2011) and expressed as a percentage of GDP (15.4%).
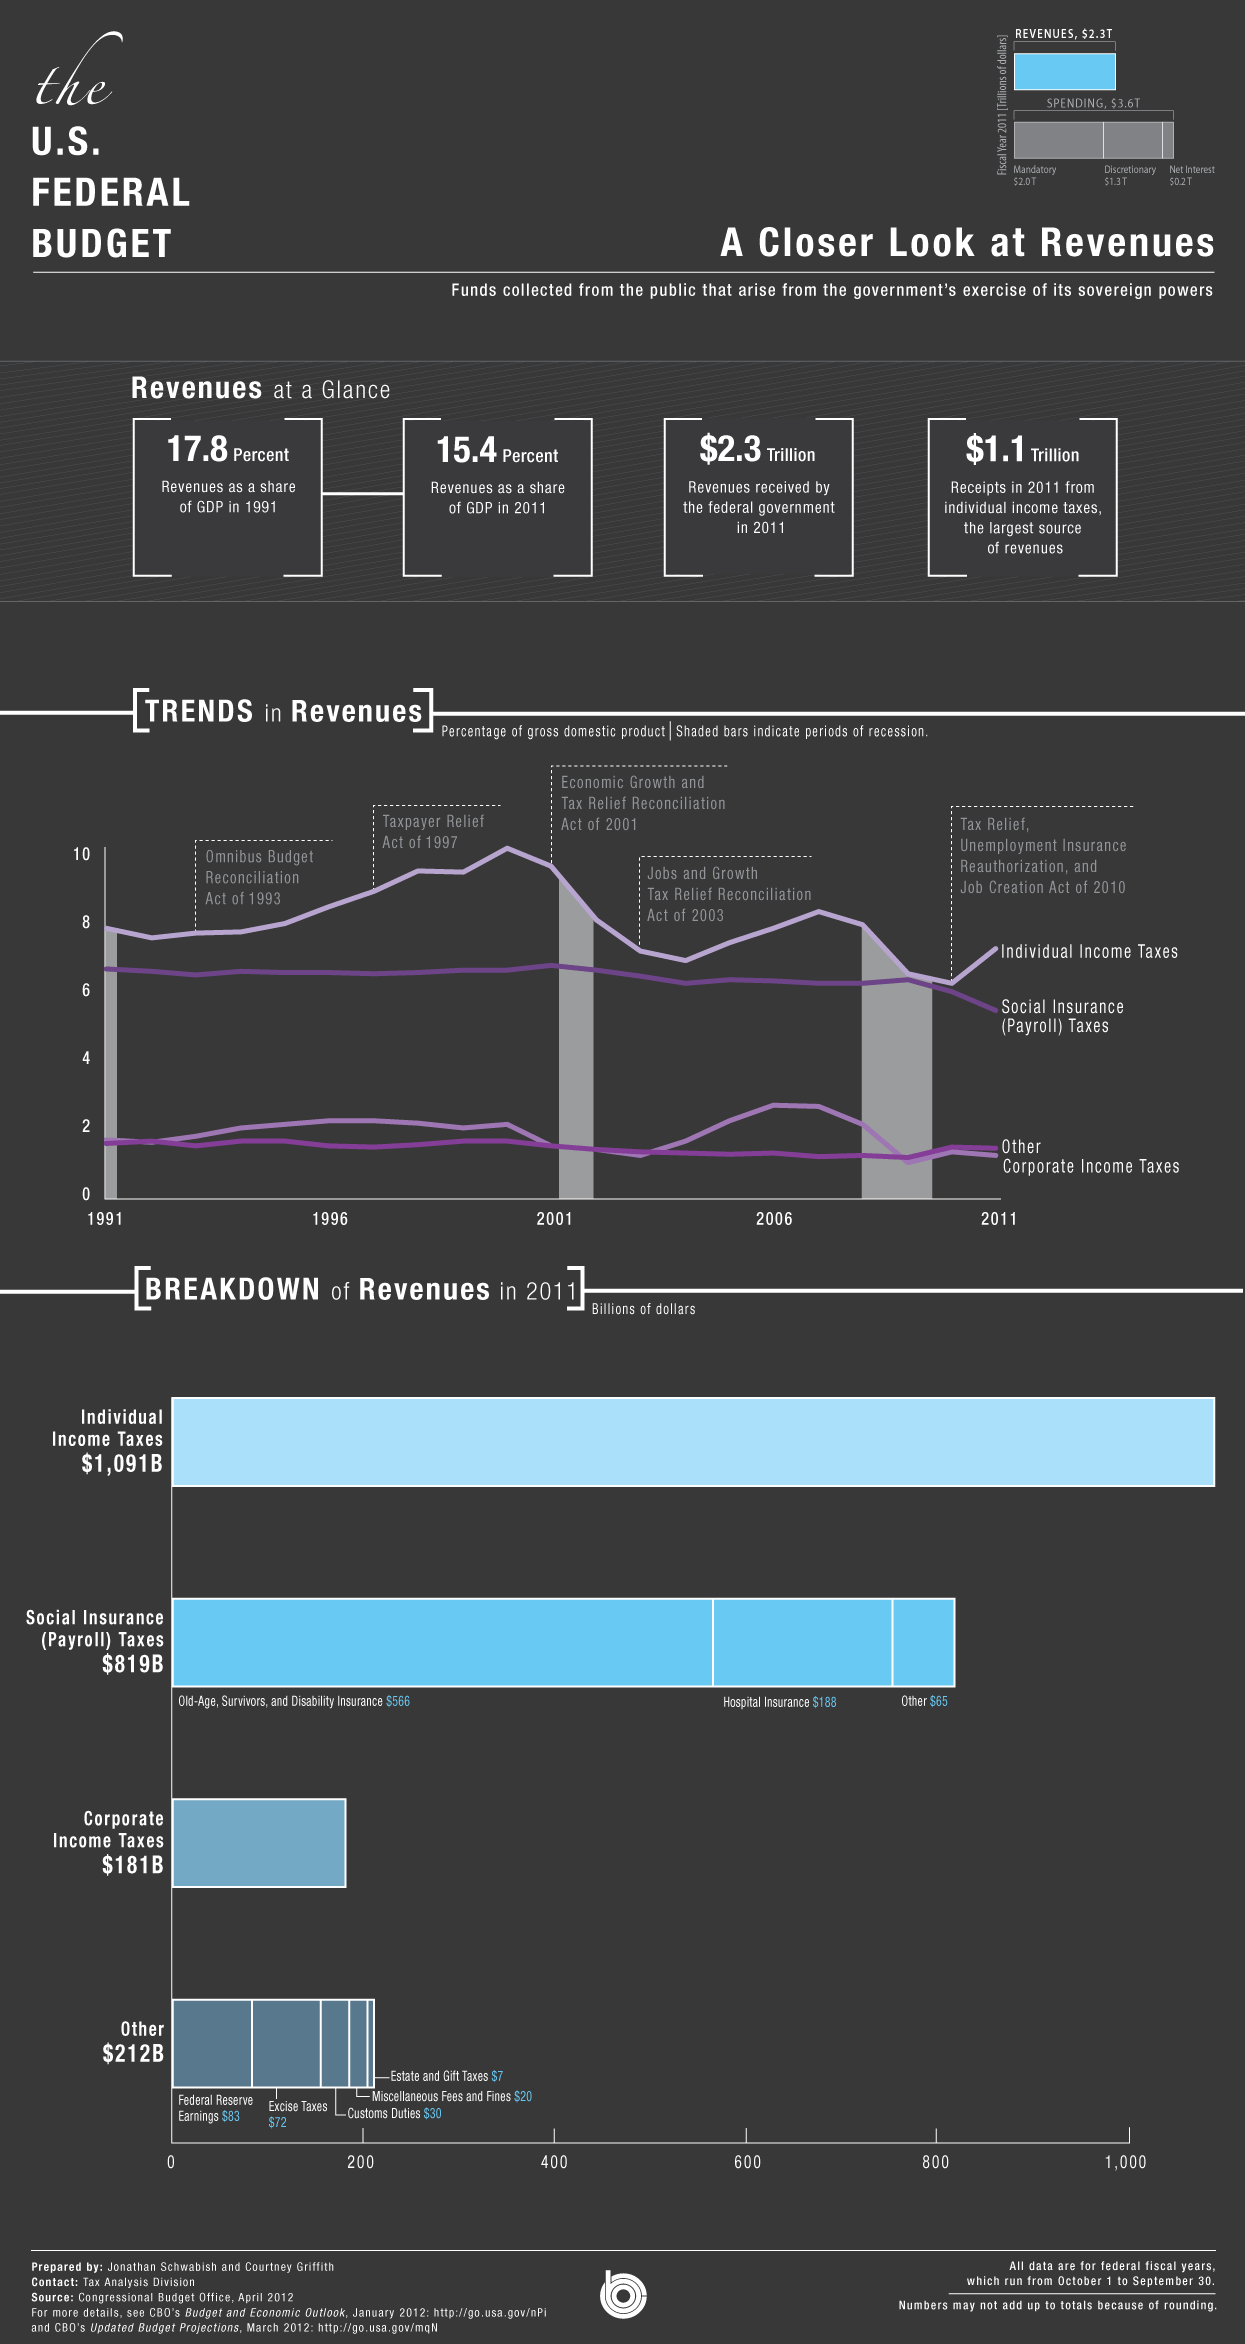
There are a lot of interesting things about this graphic. Check out the massive downward swing of payroll tax receipts starting in 2009… coinciding not only with the dismal rate of employment in the country, but also the demographic trend of having fewer and fewer baby boomers paying in to the system.
It’s also interesting to note that, by comparison, 2011 US tax revenue is roughly twice what is was 20-years prior. Yet over the same period, the federal debt has ballooned nearly five-fold.
The next graphic is mandatory spending– essentially Social Security, Medicare, federal unemployment, and federal retirement programs. Note: this doesn’t include things like defense, interest on the debt, etc.
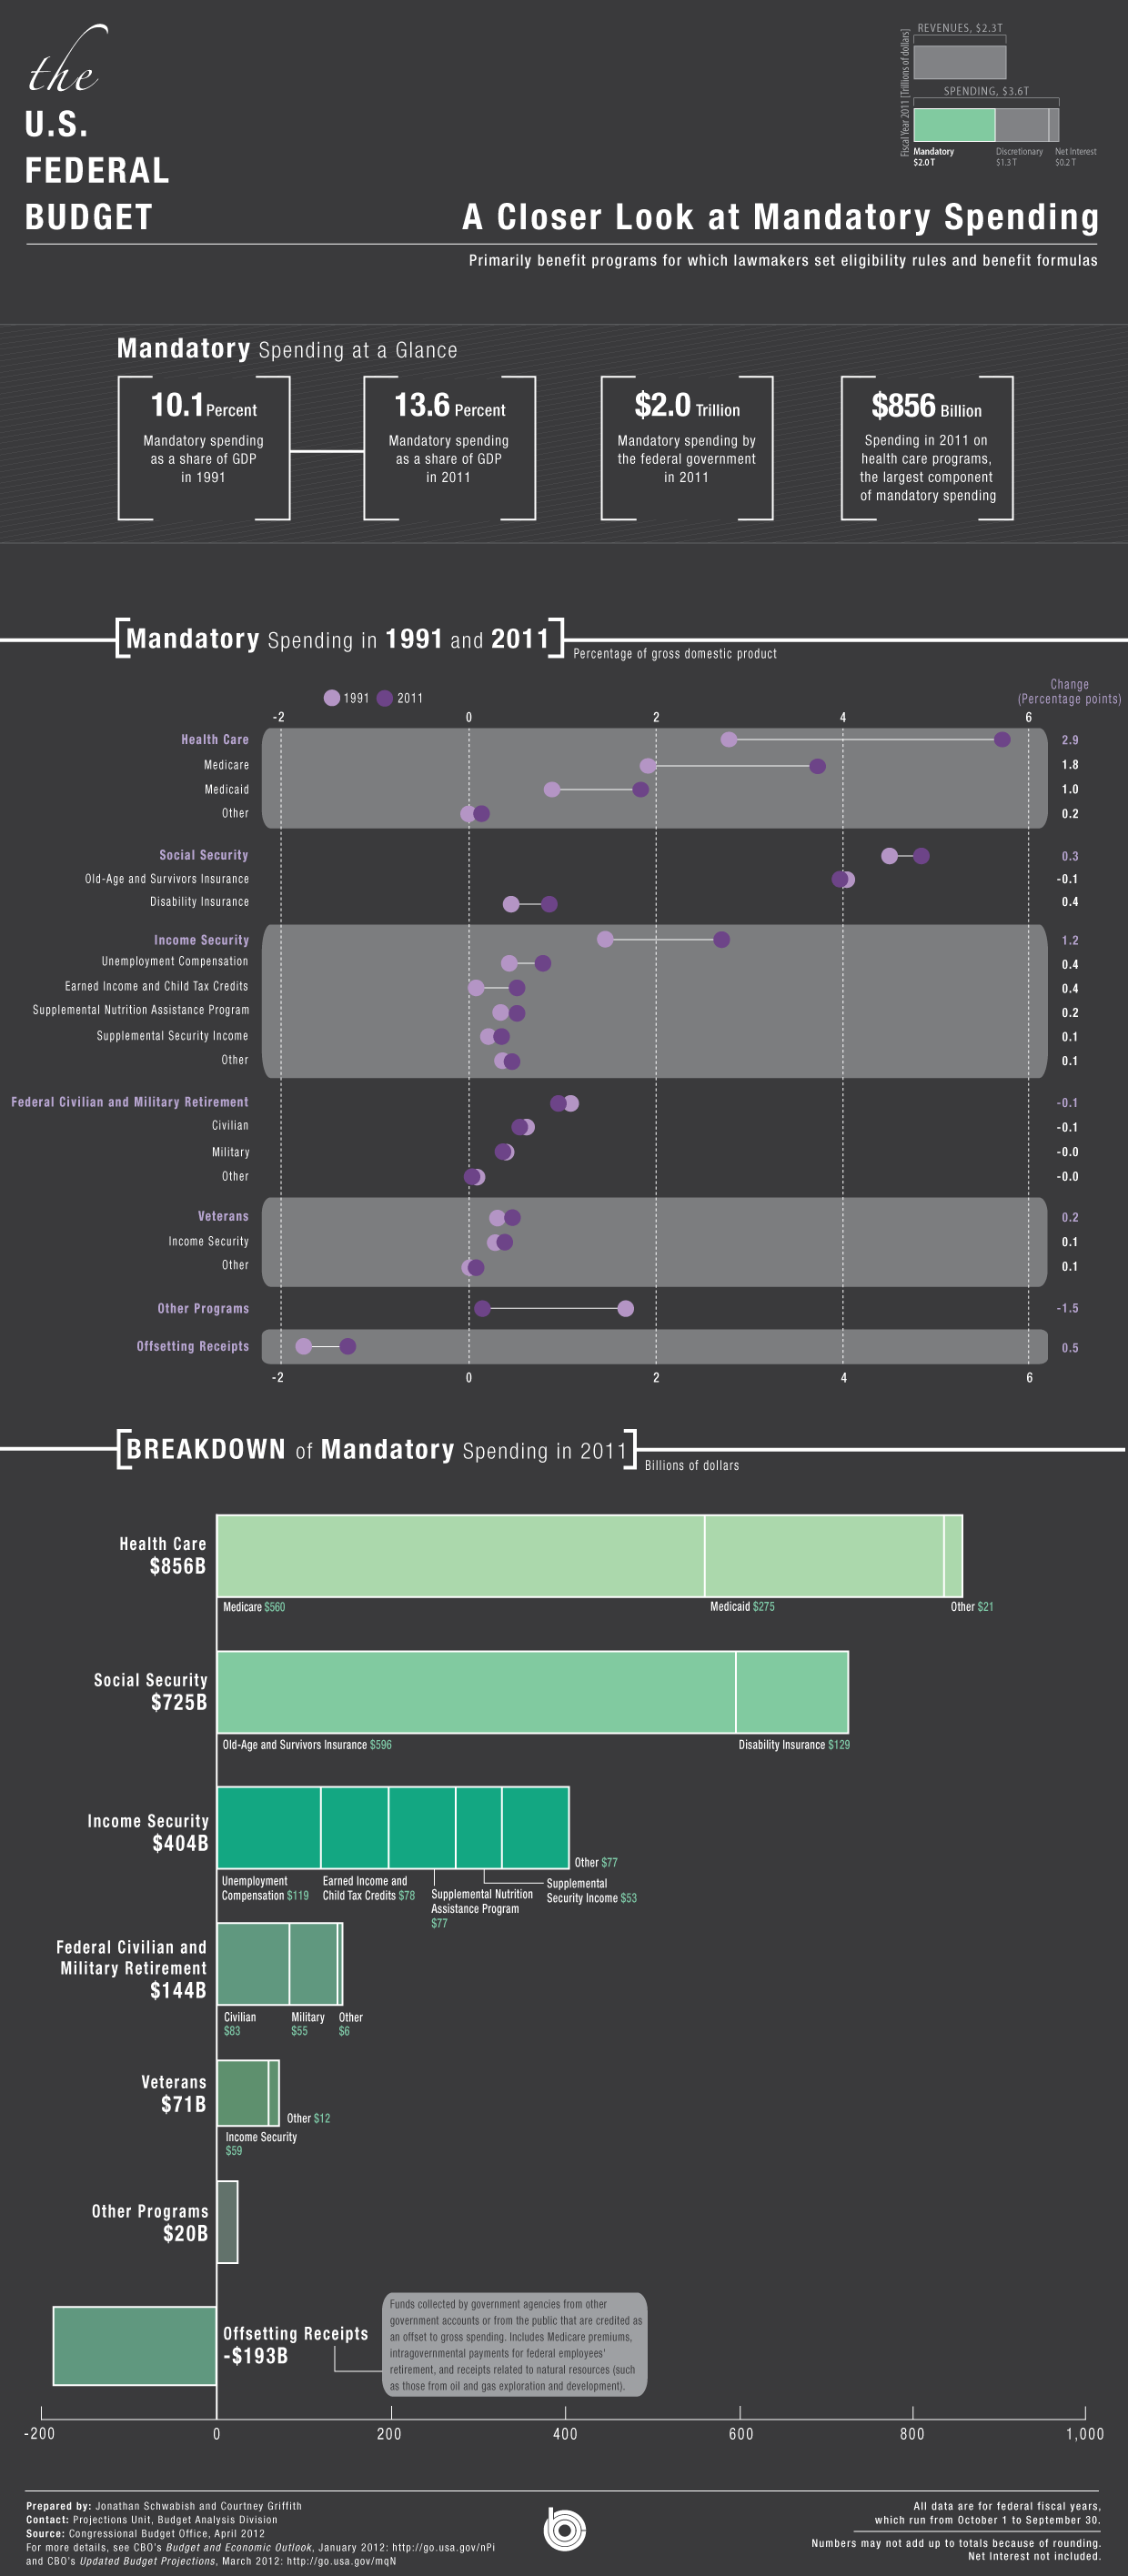
At $2.0 trillion, these mandatory entitlements comprise a massive 87% of all taxes collected. Put another way, they constitute 13.6% of America’s 2011 GDP. Incredible.
The last graphic shows ‘discretionary’ spending– another $1.3 trillion. The bulk of this is defense ($699 billion), itself nearly 5% of GDP. The rest of it goes to child molesting TSA agents, government-administered education, and all the legions of three letter agencies.
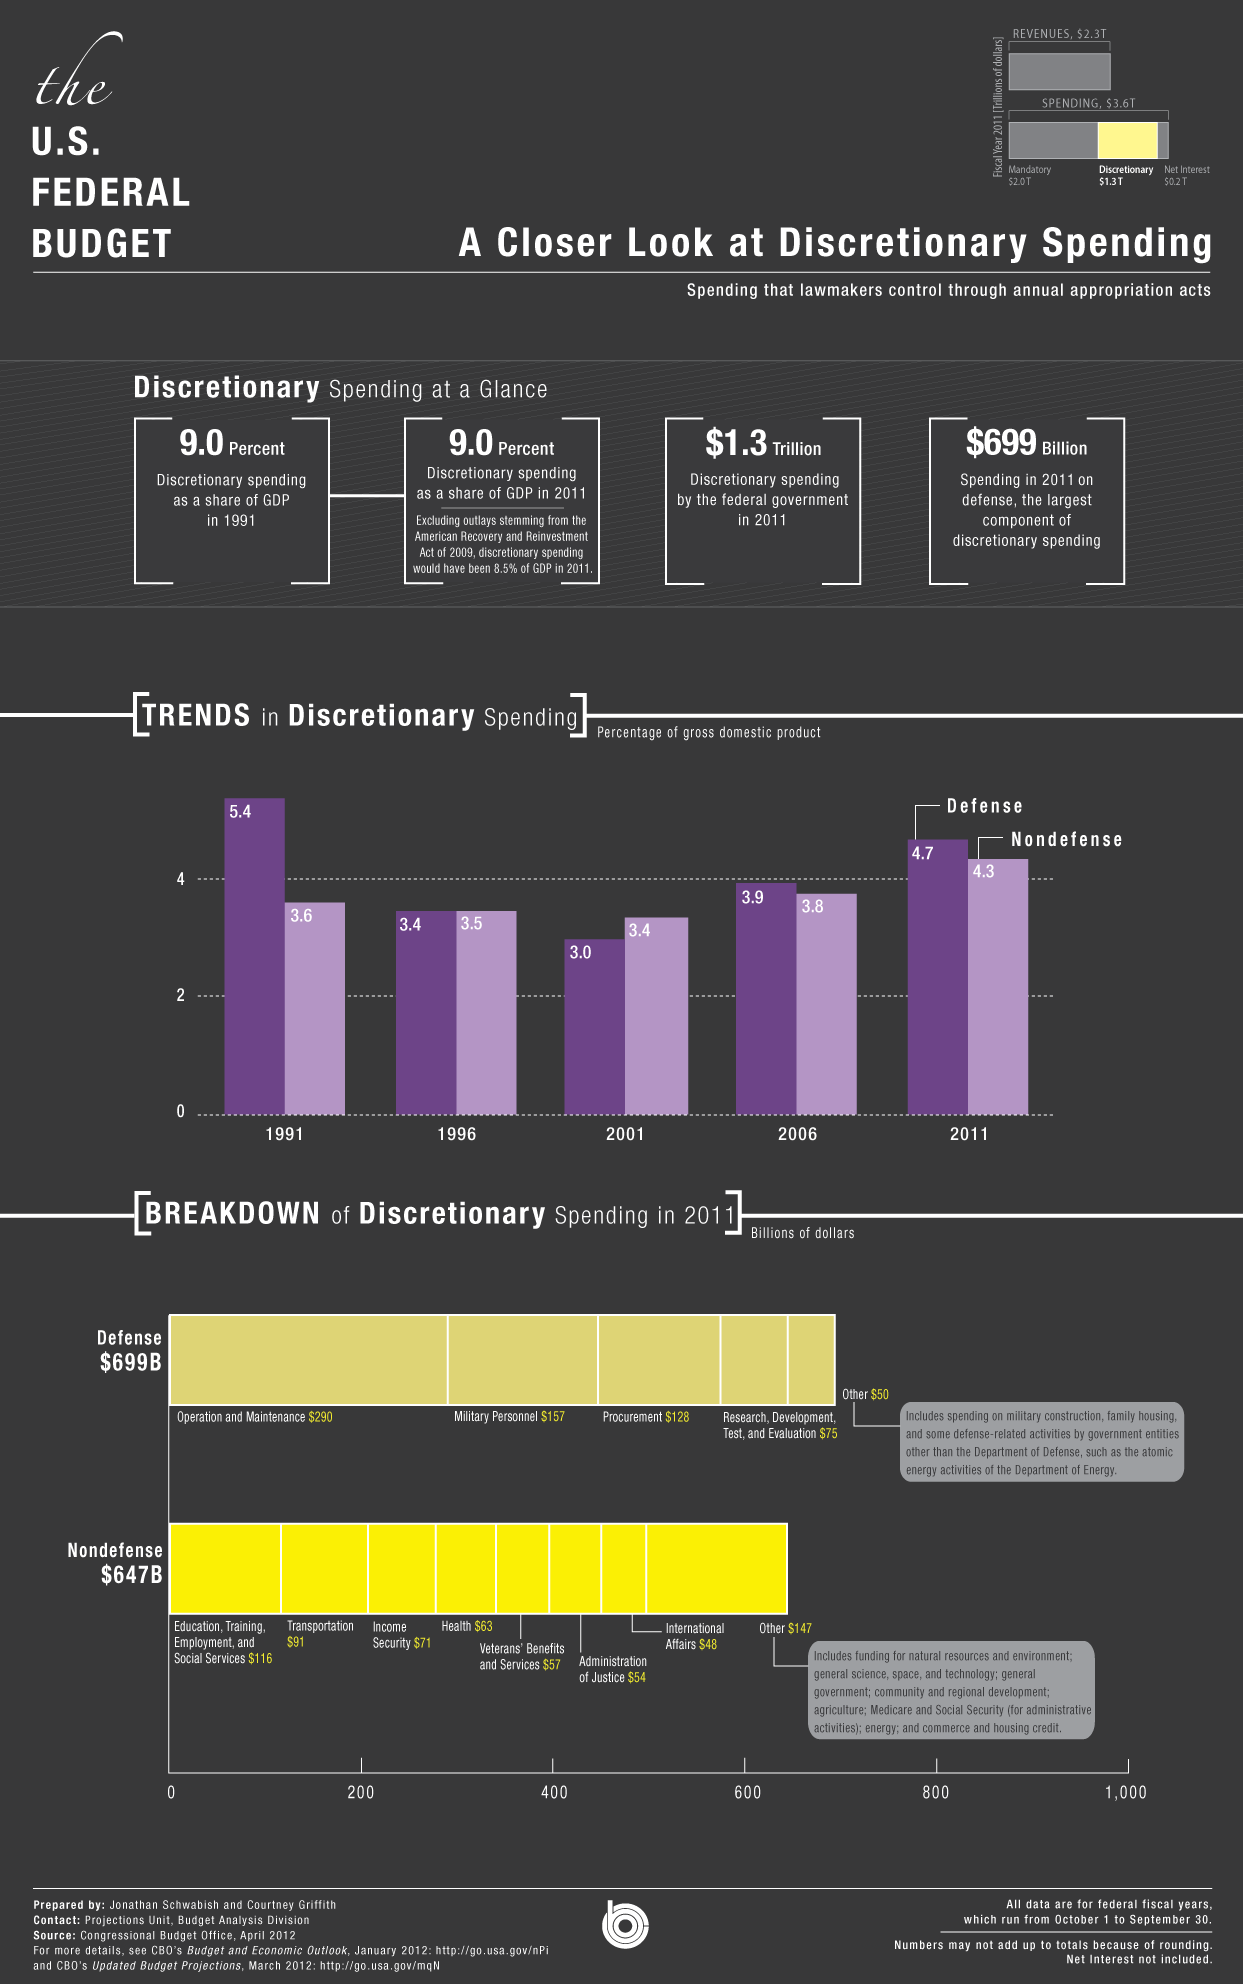
At the very bottom corner is a most disingenuous statement that says ”Net Interest not included.” In other words, they didn’t bother to include the $454,393,280,417.03 (nearly half a trillion dollars) that the US government spent on interest last year.
To put this number in perspective, the US paid more in interest last year than the entire GDP of Saudi Arabia, or the combined GDPs of the smallest 82 economies in the world. Not exactly a trivial number… unless you’re Tim Geithner.
A few days ago, Geithner quipped on NBC’s Meet the Press that there is ”no risk” of the US turning into Greece over the next few years due to such extraordinary fiscal imbalances.
This is the same guy who said there was no risk of the US losing its AAA credit rating, and that inflation on a global level is “not high on the list of concerns…”
Whether it’s lies, ignorance, or arrogance is irrelevant at this point. The situation is what it is. It’s not going to go away just because the political leadership denies it.
Each one of us has a choice. We can either bury our heads in the sand, just like they’re doing… or embrace reality and take control of our own financial futures.
http://www.sovereignman.com/expat/presenting-the-us-governments-infographic-of-its-own-insolvency/
The Congressional Budget Office has just released three very telling infographics which, unintentionally, spell out a pretty dreary picture of US government finances.
The first graphic shows US federal revenue, both in raw numbers ($2.3 trillion in 2011) and expressed as a percentage of GDP (15.4%).
There are a lot of interesting things about this graphic. Check out the massive downward swing of payroll tax receipts starting in 2009… coinciding not only with the dismal rate of employment in the country, but also the demographic trend of having fewer and fewer baby boomers paying in to the system.
It’s also interesting to note that, by comparison, 2011 US tax revenue is roughly twice what is was 20-years prior. Yet over the same period, the federal debt has ballooned nearly five-fold.
The next graphic is mandatory spending– essentially Social Security, Medicare, federal unemployment, and federal retirement programs. Note: this doesn’t include things like defense, interest on the debt, etc.
At $2.0 trillion, these mandatory entitlements comprise a massive 87% of all taxes collected. Put another way, they constitute 13.6% of America’s 2011 GDP. Incredible.
The last graphic shows ‘discretionary’ spending– another $1.3 trillion. The bulk of this is defense ($699 billion), itself nearly 5% of GDP. The rest of it goes to child molesting TSA agents, government-administered education, and all the legions of three letter agencies.
At the very bottom corner is a most disingenuous statement that says ”Net Interest not included.” In other words, they didn’t bother to include the $454,393,280,417.03 (nearly half a trillion dollars) that the US government spent on interest last year.
To put this number in perspective, the US paid more in interest last year than the entire GDP of Saudi Arabia, or the combined GDPs of the smallest 82 economies in the world. Not exactly a trivial number… unless you’re Tim Geithner.
A few days ago, Geithner quipped on NBC’s Meet the Press that there is ”no risk” of the US turning into Greece over the next few years due to such extraordinary fiscal imbalances.
This is the same guy who said there was no risk of the US losing its AAA credit rating, and that inflation on a global level is “not high on the list of concerns…”
Whether it’s lies, ignorance, or arrogance is irrelevant at this point. The situation is what it is. It’s not going to go away just because the political leadership denies it.
Each one of us has a choice. We can either bury our heads in the sand, just like they’re doing… or embrace reality and take control of our own financial futures.
http://www.sovereignman.com/expat/presenting-the-us-governments-infographic-of-its-own-insolvency/
